101 Web Design Statistics, Facts 2021 You Must Know

Your website plays an important role in building the credibility of your brand. And the effect of the quality of your website is immense. Having a strong social media presence but an unappealing website will reap no good.
Source: Giphy
Here is a list of 101 Web Design Statistics, Facts 2021 that will help you create a better website design. From interaction to user-friendliness and everything in between, we have tried to cover all the important facts and figures that you must know related to website design.
101 Web Design Statistics, Facts 2021
| S. No. | Web Design Statistics, Facts |
| 1 | Design-related first impressions of a website have found out to be 94%. (PRNewswire) |
| 2 | To form an opinion about your website, it takes about 50 milliseconds (0.05 seconds) for users. (Tandfonline) |
| 3 | To tell visitors what they can get out of your website and company, you have 10 seconds. (TransactionAgency) |

Source: Giphy
| 4 | Area of a website that most influences user’s first impression, It takes 2.6 seconds for a user’s eyes to land on that area. (CXL) |
| 5 | Website design determines the credibility of a website for 75% of consumers. (Kinesis) |
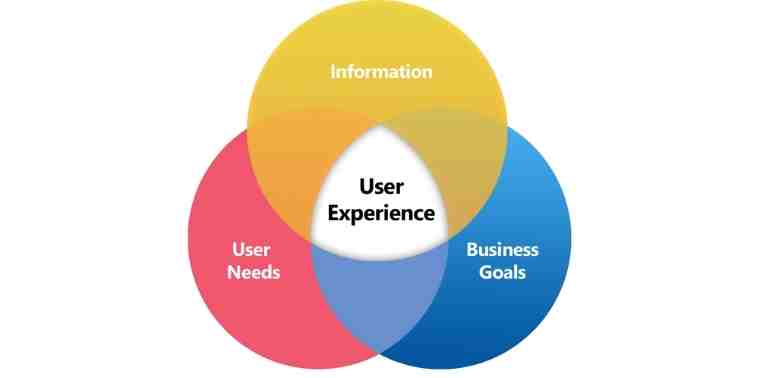
| 6 | An online user experience testing is presently conducted by 55% of companies. (SmallBizGenius) |
Want to know how to make a better website design? Do check out our blog and Explore the World of Web Designing with New Trends. This blog will help you learn about the latest trends that you must integrate right now.
| 7 | After a bad experience, 88% of online consumers are less likely to return. (InsideDesign) |
| 8 | Ux-optimized sites are preferred over a plain site by more than 88% of online consumers. (InsideDesign) |
| 9 | Everything that really matters as per 95% of the visitors is a good user experience. |
| 10 | The weakness of clients for 77% of agencies comes out to be a bad website user experience. (SlideShare) |
| 11 | After a poor user experience, 89% of consumers shop with a competitor. (Oracle) |
| 12 | Mobile device accessed company’s website should be as good or better than its desktop web is thought by 85% of adults. (InsideDesign) |
| 13 | If the content is not displaying well on the device, 25% of users stop engaging with it. (Adobe) |
| 14 | When the site is mobile-friendly, it is more likely for 67% of mobile users (as said by them) to buy a site’s product or service. (Google Analytics) |
| 15 | A mobile-friendly website will more likely see a return of 74% of users. (Think With Google) |
| 16 | Calling or visiting that business within 24 hours is practiced by 88% of consumers who search for a type of business on a mobile device. (Nectafy) |
| 17 | A poorly designed mobile website design will not be recommended by 57% of internet users. (BolderCreative) |
| 18 | If a website is mobile-friendly, 67% of mobile users say they’re more likely to buy that site’s product or service. (Google Analytics) |
| 19 | If having trouble accessing a mobile website, it is unlikely that 61% of users will return and 40% visit a competitor’s site instead. (McKinsey & Company) |
| 20 | A bad mobile experience for 52% of users made them less likely to engage with a company. (Google Analytics) |
| 21 | As compared to desktop conversion rates, average smartphone conversion rates are up 64%. (SmartInsights) |

| 22 | If the content of a website is too long, 38% of people will stop engaging with the website. (Adobe) |
| 23 | Depending on the visual appeal and aesthetics of a website, 46% of consumers based their decisions on the credibility of websites, as per a study. (NewLineDigital) |
| 24 | If the content of a website is unattractive, 38% of people will stop engaging. (Adobe) |
| 25 | A beautifully designed material would be preferred to be read by 66% of people than something plain if they have 15 minutes to consume content. (Adobe) |
| 26 | After reading the custom content of a company, 82% of consumers trust it. (Getgist) |
| 27 | An average of 5.94 seconds is spent by the users looking at a website’s main image. (CXL) |
Looking forward to gaining the trust of your customers? Do read our comprehensive blog on Loyalty Building: 7 Easy Web Design Strategy To Gain Audience’s Trust.
| 28 | Making an unplanned purchase can be likely made by 34% of consumers if a brand has personalized content. (Forbes) |
| 29 | An average of 5.59 seconds is spent by users looking at a website’s written content. (CXL) |
| 30 | 88% more time is spent by the users on pages with videos. (Forbes) |
| 31 | 55% of people look at lists without bullet points whereas 70% of people look at lists with bullet points. (KendraKreative) |

| 32 | Making a purchase’s primary reason for 84.7% of consumers is the colour of the website. (Webfx) |
| 33 | Web recognition was increased to around 80% with the use of intense colors. 2% of growth is experienced by websites using dark color themes and 1.3% growth by light color themed websites. (Ironpaper) |
| 34 | The maximum time of loading for an average website as expected by 47% of users is 2 seconds. (Curatti) |
| 35 | A cost of $2.6 billion to retailers lost in sales each year is because of slow-loading websites. (Econsultancy) |
| 36 | If images take too long to load on a website, 39% of people will stop engaging. (Adobe) |
| 37 | 1-second page delay for an e-commerce site that is making $100,000 per day could potentially cost them $2.5 million in lost sales every year. (Neil Patel) |
| 38 | The loss of 7% of possible conversions can be prevented by increasing your website loading speed. (Insivia) |
If background textures confuse you, you must bookmark our blog, ‘How To Use Background Textures In Web Design?’ and definitely read it.
| 39 | If a website takes more than three seconds to load about 40% of users exit. (Entrepreneur) |
| 40 | Your sales can drop by 7% for a single second of added page load speed. (Neil Patel) |
| 41 | Boosting your conversion rate by up to 74% can be enabled with a hike from 8 to 2 seconds in site speed. (Kinsta) |
| 42 | For online merchants as big as Amazon, page load time could lead to $1.6 billion in annual losses for every one-second delay. (FastCompany) |
Source: Giphy
Learn more about website design with our detailed blog on Web Development 101: 5 Steps for the Perfect Web Design.
| 47 | A lack of call-to-action on their homepage is possessed by 70% of small business websites. (Business2Community) |
| 48 | 36% of visitors, after reaching a company’s website via a referral site, will click on the company’s logo to reach the homepage. (KoMarketing) |
| 49 | Smartphones held a 63% share of all retail website visits as of Q2 2018. (sweor) |
| 50 | Viewing a product or service on the homepage is expected by 86% of website visitors. (KoMarketing) |

Source: Hubspot Blog
| 51 | A beautifully designed website is preferred by two out of three people. (Blog red) |
| 52 | Before making a purchase in a physical store, 81% of customers search online. (Impact) |
| 53 | 20 days is the average time between a product search and an online purchase, which is 26 for Amazon. (Word Stream) |
| 54 | 61% of Gen Z customers, in 2020, said they have ordered groceries online. (Chain Store Age) |
| 55 | Purchasing products in physical stores is said by only 9.6% of Gen Z shoppers. (Bigcommerce) |
| 56 | Within 5 days, 35% of all product searches on Google end up in a bank transaction. (Word Stream) |
| 57 | A total of 23 million web developers in 2018 were there in the world. (C# corner) |
| 58 | 100% ROI can be received from UX investment. (Youpicom) |
| 59 | If the user experience is good, 90% of smartphone users say they’d continue to shop with that website. (Topal) |

Source: Giphy
| 60 | Due to poor user experience, 70% of users have abandoned their shopping carts. (Aquent) |
| 61 | To differentiate their brand from the competition, 73% of companies invest in design. (Blue Corona) |
| 62 | In the last 6 months, 83% of US-based consumers have purchased something on Amazon. (Bigcommerce) |
| 63 | e-retail spending in the US, by 2022, is expected to reach $638 billion. (Statista) |
| 64 | Mobile devices are responsible for 40% of transactions. (Blue Corona) |
| 65 | A poorly designed website on mobile would not be recommended by 57% of internet users. (sweor) |
Get to know more about UI/UX designs and what mistakes to avoid with our blog, E-commerce Website UI/UX Design Mistakes to Avoid.
| 66 | More than 92% of the search engine market is with Google. (Statista) |
| 67 | Mobile-friendly websites are most likely to see a return of 74% of users. (Web FX) |
| 68 | In 2020, 50.81% of internet traffic came from mobile devices. (Statista) |
| 69 | The most crucial element missing, as per 51% of users, from a company’s website is “Thorough contact information”. (KoMarketing) |
| 70 | Multiple devices are used by 90% of people to visit the same website. (Google) |
| 71 | Lousy navigation could lead to 61.5% of visitors leaving the websites. (Goodfirms.co) |
| 72 | Brand recognition can be increased by 80% by color alone. (Loyola University, Maryland study) |
| 73 | 86.9% of websites were using HTML5 as of March 2021. (w3techs) |

Source: freeCodeCamp
| 74 | ‘Ultimate grey and illuminating’ is the color of the year. (Pantone) |
| 75 | 4% of the marketers say they’re hopeless when it comes to responsive design, 23% say they’re behind the times, 29% say they have an “average” experience level and 22% of marketers say they’re ahead of the curve. (eMarketer) |
| 76 | Dynamic, personalized content is important for 69% of North American marketers for their website. While only 5% say it’s of low importance. (Marketing Charts) |
| 77 | If a business’s website is not mobile-friendly, 48 percent of users say that they’ll take it as an indication that the business simply doesn’t care. |
| 78 | Nearly 2 of every 3 minutes spent online is through a mobile device. (ComScore) |
| 79 | ‘Good user experience just makes sense’ is agreed by more than 9 out of 10 respondents (95%). |
| 80 | Search for B2B products is done by 40% of smartphone and tablet owners on those devices. (KoMarketing) |
| 81 | Multiple screens sequentially are used by 90% of people. (uberflip) |
| 82 | There are over 1.8 billion websites online. (Internet Live Stats) |
| 83 | More than 89,000 Google searches are done every second of every day. (Internet Live Stats) |
Confused between different available frameworks? Visit our blog 12 Small CSS Frameworks for Best Responsive Web Designs and find out the best that works for you.

| 87 | Understanding their needs and exceeding their expectations is wanted by 66% of customers from the brands. (Salesforce) |
| 88 | 69% of website content on average is never seen by visitors. (ContentSquare) |
| 89 | Convenience is more important for 65% of B2B and 71% of B2C users than which brand they buy from. (Salesforce) |
| 90 | Empathy from brands is required for 68% of consumers. (Salesforce) |
| 91 | The fast purchase increases the chances of conversion for 77% of smartphone shoppers. (Think with Google) |
| 92 | 62% of companies increased their sales by designing responsive mobile platforms for their websites. |
Do you want to use Magento but is it the right choice? Find your answer with our write-up, 15 Best Magento eCommerce Website Examples.
| 93 | Multiple devices would be used by 66% of customers to begin and complete an online transaction. (Salesforce) |
| 94 | It takes users 3 sessions, on average, to convert. (ContentSquare) |
| 95 | 4.35% of desktop users add items to their carts compared with 8.95% of mobile users. (Monetate) |
| 96 | 1.98% of desktop users convert as opposed to 1.81% of mobile users. (Monetate) |
| 97 | People read the content of your website in an ‘F’ shaped pattern. |
Source: Medium
| 98 | 88% of people trust online reviews as much as personal recommendations. (Search English Land) |
| 99 | $80 million made Microsoft rank extra by changing links to a shade of blue. (CNet) |
| 100 | Orange and green convert better than other colors. (WordStream) |
| 101 | Web pages that load in 3.3 seconds experienced a bounce rate of 20% whereas the pages that load 2.4 seconds had a bounce rate of 12.8%. (Soasta) |
101 Web Design Statistics, Facts 2021: In a Nutshell
All these statistics and facts related to Web design talk about lower loading time and higher response in general. Which of these facts shocked you the most? Website design has played a crucial role in helping people decide to choose that brand or not.
Get Your Own Responsive Website
VerveLogic is a leading Progressive Web Apps Development Company that can help you create the best web apps. We have a team of expert web app developers assisting you with the creation of responsive, robust, and appealing websites with minimal loading times. We make use of the latest technologies to deliver ultimate results. Our support team is available 24/7 to provide seamless services to your customers. Do contact us for further details and request a quote with no hidden charges.


The blog is a confidence booster for those who want to create a business website in 2021. This is a pretty positive article..