Google Play Store Stats Of 2019-2020 You Should Know

The Google Play Stats explains the success story of Google is known by the world and this player has revolutionized the technology industry in many ways by its services. Let us dive deeper to know better about Google and services offered by it. Now famously known as “Google Play Store” was originally born as the “Android Market” on 22 November 2008 by Google as an official store and portal for Android apps, games and other content for your Android-powered phone, tablet or Android TV device. The Android Market allows users to download apps separately. For instance, users can download apps like music from Google music, electronic books from Google eBookstore etc.
These multiple stores used to create confusion among the users that is why Google took a huge step launching “Google Play Store” on March 6, 2012. Under Google Play Store all of the Android operating system’s content stores were integrated into one platform to make it convenient for Android users to access the apps. Just like Apple has the Apple Store, Google has the Google Play Store. In the beginning, the Google Play Store added support for paid apps in 2009 in the US and UK, and later on, it expanded globally in the year 2010. It is the same year when Google eBookstore was launched and after one year Google Music was launched in the US.
According to the Google play store statistics, 90% of mobile time is spent on apps. To understand the market of Google Play Store, we have listed the interesting top Google Play Store Statistics in 2019-2020. A large number of extremely talented developers and engineers introduced Mobile App Development, which changed the world in many ways. Mentioned below are the Google play stats in 2019-2020 which you need to know.
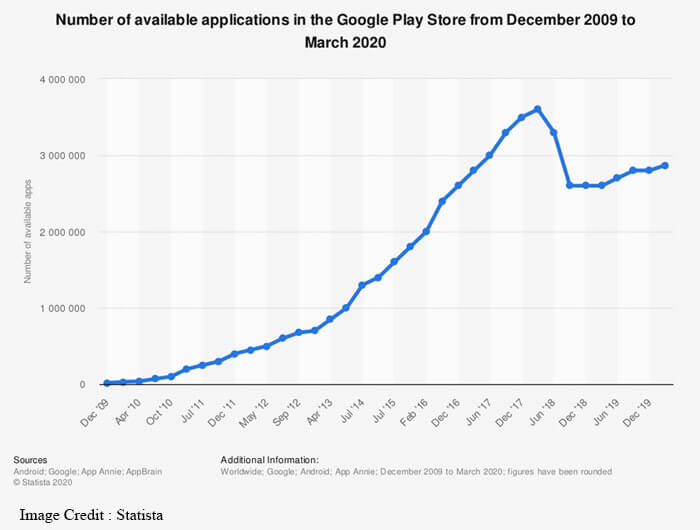
1. Total Number of Apps on Google Play Statistics:
Popularly known as the most trusted platforms all across the globe, millions of users operate Google every single day. As a result of the increase in the number of users, app developers felt the need for more and more apps to be made available on apps stores like Apple Store and Google Play Store. In the year 2019, the Android users were able to choose between 2.57 million apps while on the Apple store, there were only 1.84 million apps.. Clearly it made Google Play the app store with the biggest number of available apps in 2019 and this number is predicted to rise further by the end of 2022.
2. Revenue Generated By Google Play Store:
When it comes to revenue generation, the stats of both the Apple store and Google Play store varies. Applications generate revenue in certain ways like by charging users a small amount of money for the use of an app, for access to premium features of an otherwise free app, selling ad space etc.
The gross revenue brought in by the app store was $14.2 billion in the third quarter, up from $11.6 billion a year ago. The revenue generated by Google Play grew by 24% to $7.7 billion in 2019. While, despite the fact that Google powers over 75% of all mobile devices globally, still Apple represented approximately 65% with Google representing the other 35%. This shows that Android is still very underscoring as compared to Apple in terms of monetization.
3. Total Number Of Apps Downloaded On Google Play Store:
Both the Apple App Store and the Google Play Store are two of the most prominent marketplaces in the world and both have seen drastic changes since their launch. Talking of the total number of apps downloaded on the app store, both of them have different statistics. According to a report, it is estimated that the number of per day downloads of Google Play Store statistics is around 250 million.
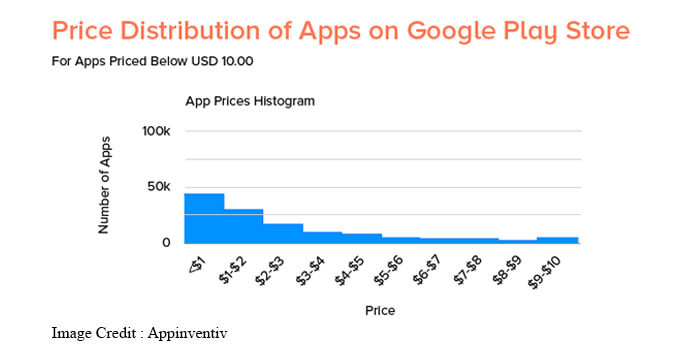
4. Price Distribution of Google Play Store Apps:
As per the December 2019 reports, the paid app price distribution for Google Play store apps priced below 10 U.S. dollars. While around 42 thousand apps were priced less than a dollar in the Google Play store, and 96.2% of all Android applications were available for free in the year 2019.
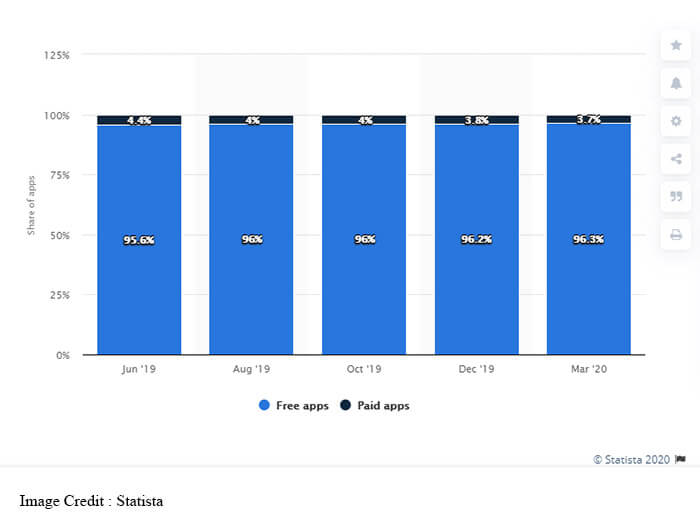
5. Free and Paid App Download Google Play Store Statistics:
Last year, there were more than 205 billion app downloads, and according to the experts’ prediction, there will be a 25% increase in global app downloads between 2018 and 2022. There are two categories of apps such as paid and free. Apps in general consist of two kinds- Paid and Free Apps. As per a research, Apple App Store has more paid apps in as compared to Google Play Store that Apple users tend to make more in-app purchases.
a. Free Android Apps
According to Android and Google Play statistics, there are currently 2,589,804 free apps on the Play Store. Most of the revenue earned by free mobile apps by app monetization strategies like in-app purchases.
b. Paid Android Apps
If we talk about paid apps, currently, there are over 1,25,894 paid apps on Google Play Store.
6. Google Play Stats for Mobile App Usage:
Google play store apps are performing under different demographics and conditions.
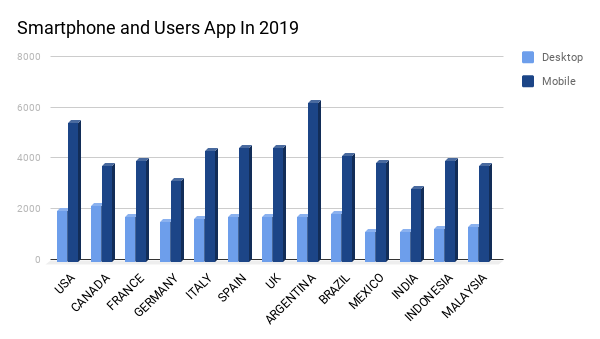
a. Global Usage of Play Store Apps
From 2016 to 2018, the usage limit of apps and smartphones is bound to increase globally to 50%. While the majority of the apps downloaded are for the Android platform.
b. App Usage by Age
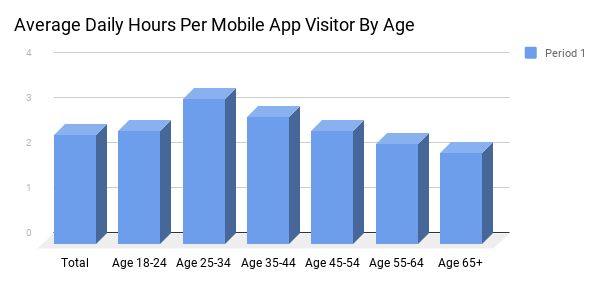
The above graph shows the frequency at which apps are opened daily by people belonging to different age brackets. On average, US app users of age 13-64 open apps 8.3 times per day.
c. Usage by Devices
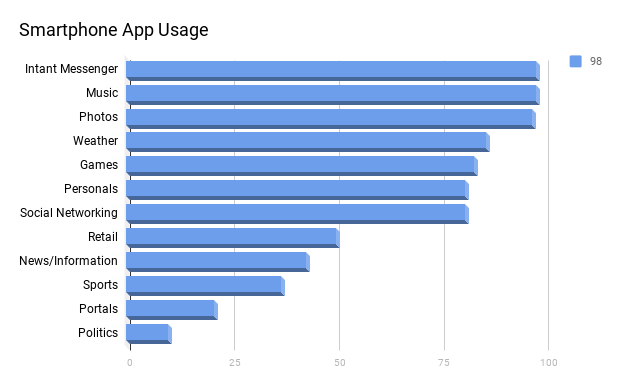
With the advancement in technology, people have access to several devices like Tablets, Smartphones, Laptops, desktops and so on. However, it has been observed that few apps like Maps, Games, Music, Weather etc. are accessed using smartphones as compared to the other gadgets.
d. Usage by Country
Google Play statistics are affected by the geographic region. Followed by US and Japan, South Korea was at the top of apps used and installed on a monthly average.
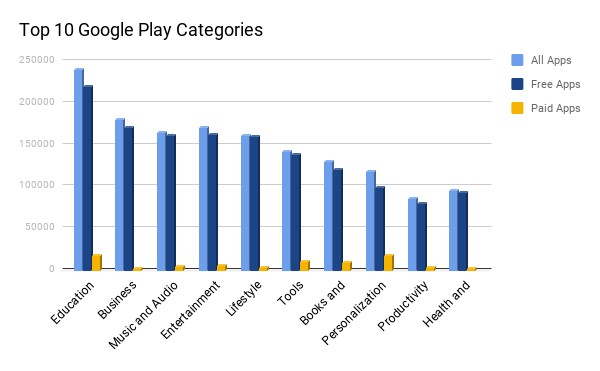
Most Popular Apps Categories in Google Play
In the year 2019, gaming apps were the most popular app category in the Google play store. Gaming apps covered 13.35% of available apps worldwide, while with a share of 8.95%, education apps stood second. See the graph below to know the number of paid and free apps in the Play Store.
Popularity Of Gaming Apps
In the year 2018, it was estimated to be 2.2. Billion mobile gamers in the world were there, out of which 203 million mobile gamers were based in the US, and 459 million were from China. Over the years, the popularity of gaming apps all across the globe brings in tons of revenue for Google Play Store. It is predicted that the popularity of gaming apps will experience an incredible rise. In the first half of 2019, the amount spent on the iOS App Store and Google Play reached $29.6 billion. Google play game spending grew by 16.8% to $12 billion which is likely to be increased by 2022. Given below is the list of top Non-Game apps which have become extremely popular due to their uniqueness, and effective features.
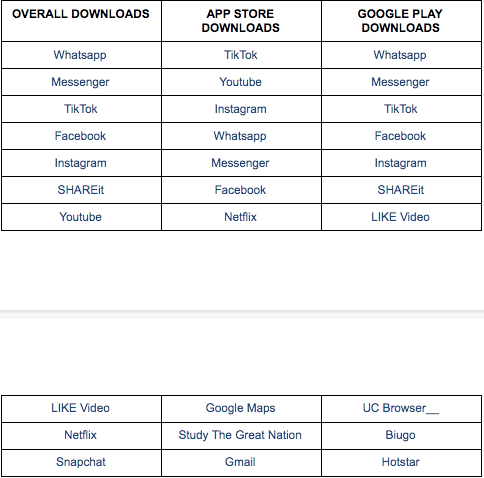
Most Downloaded Apps of Q1 2019
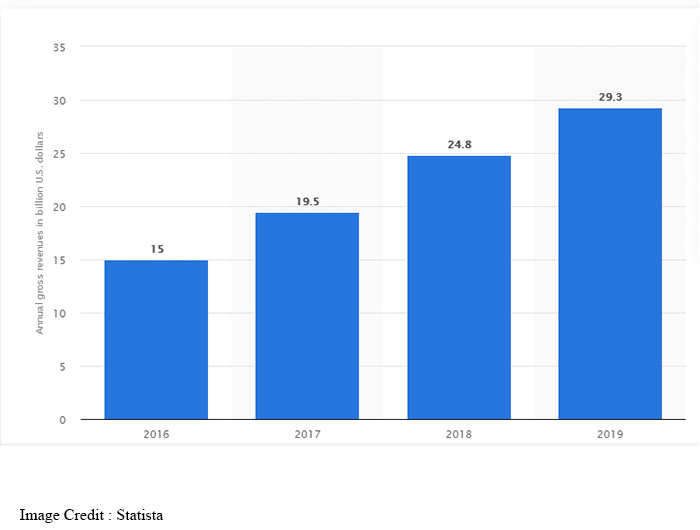
Gross App Revenue
Just in the first half of 2019, the iOS App Store and Google Play combined produced $39.7 billion in worldwide app revenue. According to Google Play Store revenue, it’s economy stats are improving every year and there’s nothing wrong in saying that Google store will overshadow the Apple store numbers.
Conclusion
After going through the above-provided information, you will get to know that not just Google but also of all the Android apps operating in the store are rising in terms of revenue and popularity. Though, as per the statistics, Apple store is a notch higher than Google but still, Google is globally taking over the IT industry and market as its user base increases per day.